
Quick answer
Figurz, an independent FF&E/OS&E consultancy with its own estimation tool, analysed about 700 hotel budgets entered in its free app (data as of November 2026). About six in ten were lower than the Figurz estimate, and about four in ten were more than 30% lower. About a quarter were more than 30% higher. The typical gap, the median, is around 15% below the estimate.
These are planned budgets, given by users before they saw our result, and they are often lower than a full estimate. They are not final accounts. The figures come from 1,161 completed free estimates (out of 1,422 started) since the app launched in 2024, as of November 2026.
How we read the gap: within about 5%, a few savings on the most recurrent items are usually enough. Around 30%, the programme or the positioning has to change, ideally before it is too late.
Key facts (data as of November 2026)
1,422 free estimates were started and 1,161 completed since the Figurz app launched in 2024.
After removing unrealistic entries (about one in five), about 700 hotel budgets were analysed.
About six budgets in ten are below the Figurz estimate. The median gap is around 15% below.
About a quarter of budgets are more than 30% above the estimate: gaps go in both directions.
Half a star of standing difference can change a hotel's FF&E budget by 40% or more.
OS&E and back-of-house together can represent up to 30% of the FF&E/OS&E budget.
Figurz invents nothing: it publishes what it collected, after cleaning it.
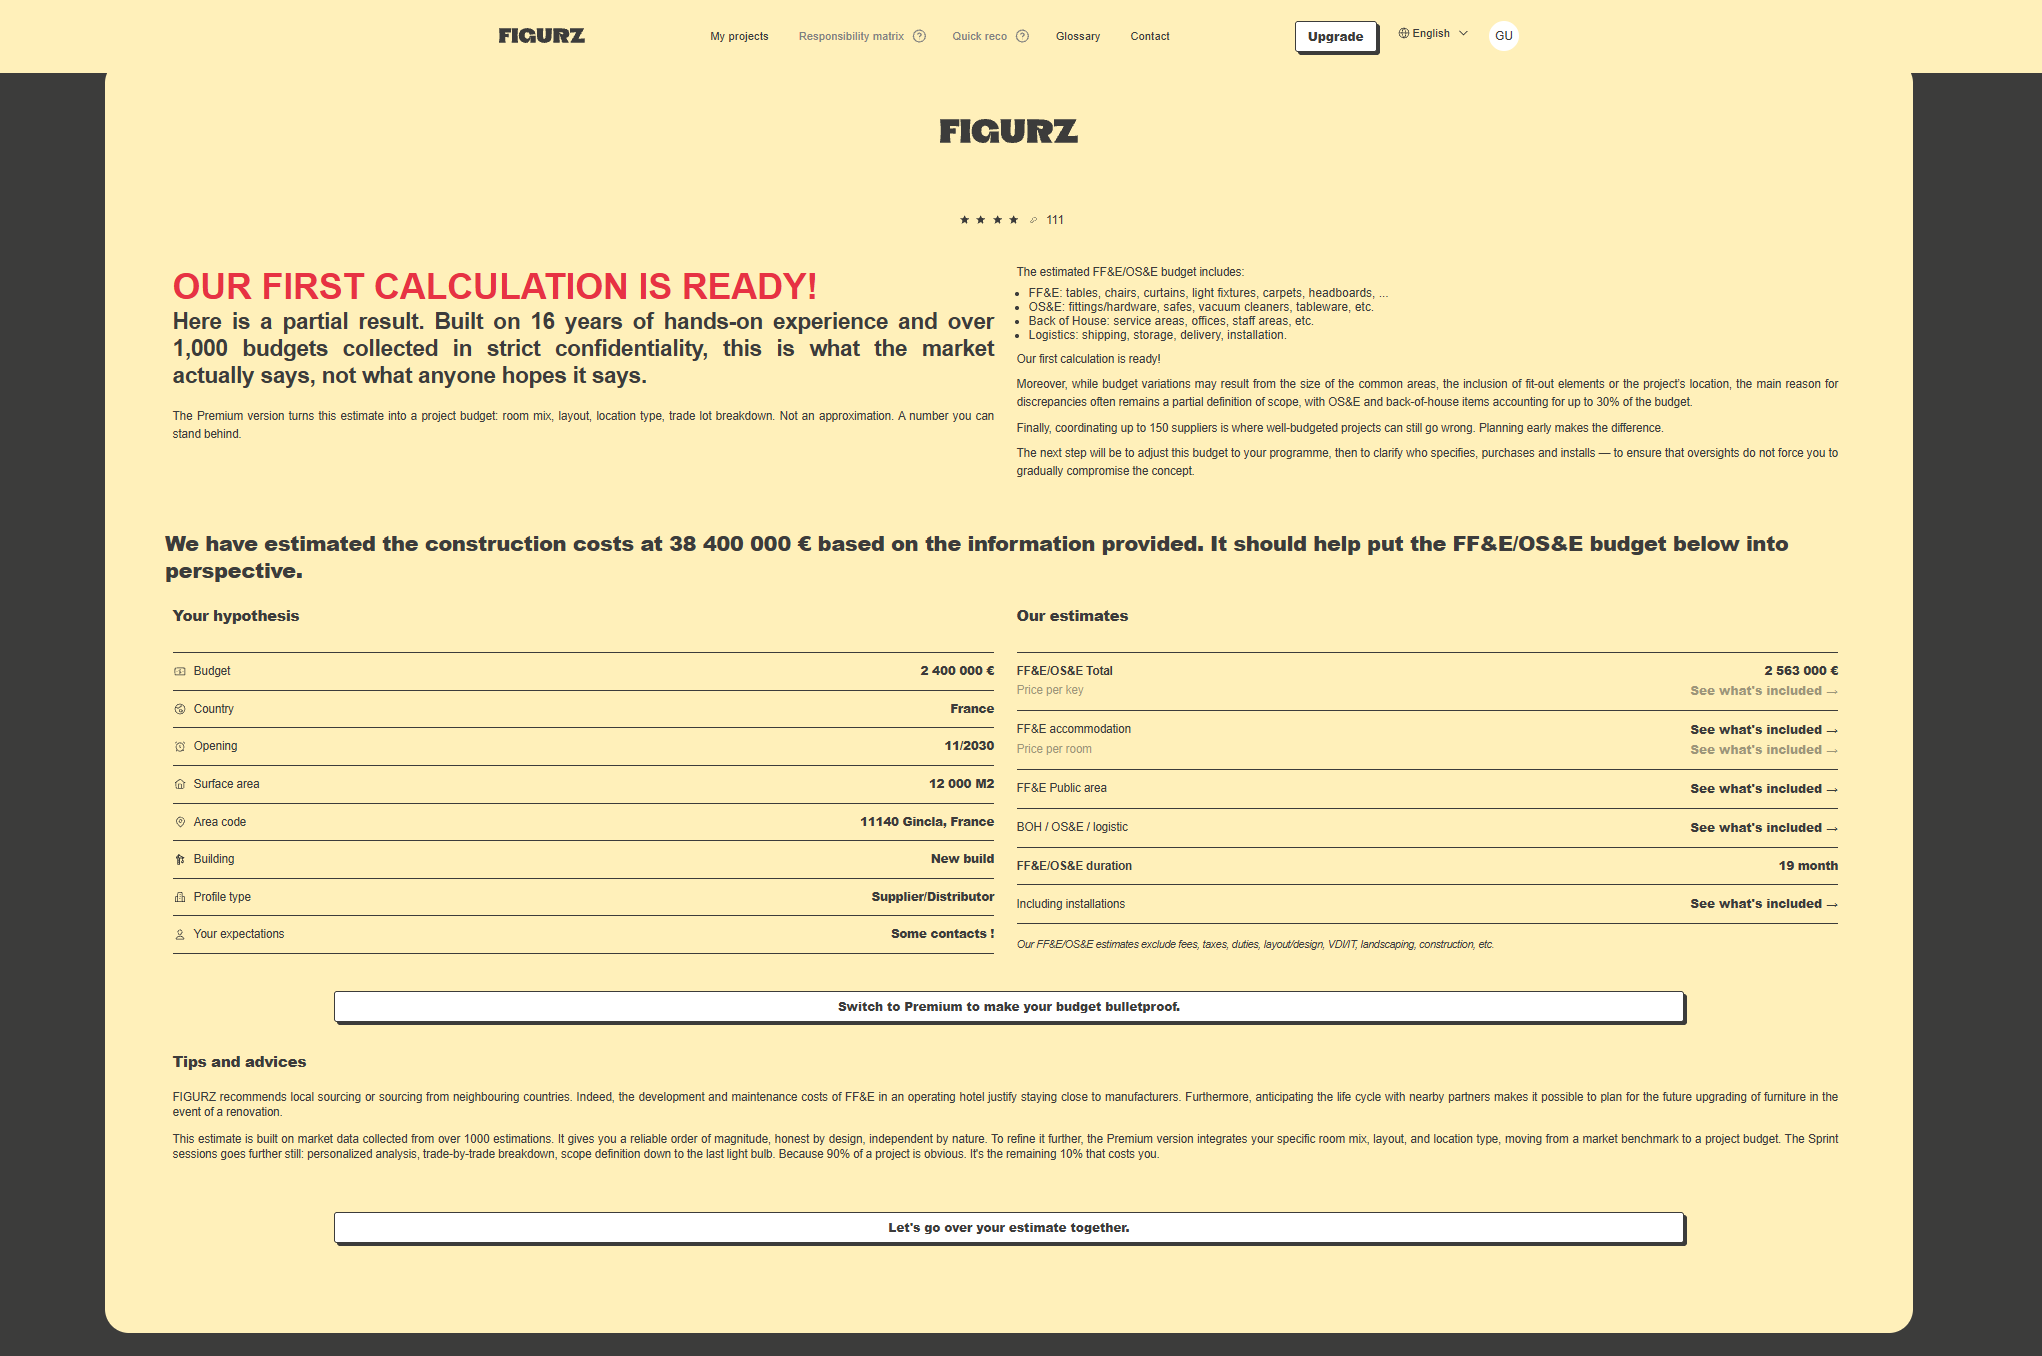
What the free estimate shows.
Why do hotel FF&E budgets differ from a full estimate?
Planned budgets are often lower than a full estimate, but a gap is rarely a mistake by one side. When it happens, we look at it with whoever gave us the budget, and the explanation is often simple: a different scope of supply, or a different split of roles between architect, operator and buyer.
One note on the free tool: it does not take the common areas, or their size, into account, so some variation is normal. Beyond that, the gaps we see most often are:
Large gaps that match the usual cost of OS&E and back-of-house, depending on who ran the simulation
A budget entrusted to the architect that covers only part of the scope
A different split of scope between the parties, so that an item is counted twice or not at all
A budget that matches a lower standing than the one announced: a hotel rated 5 stars with a budget closer to 4.5
Floor areas entered in the free questionnaire that point to very large common areas, which explains part of the difference
A budget that is coherent with what we observe is kept in the database. The others teach us something: they show what a project owner tends to leave out, and where.
Which of these explains your gap? The free tool cannot tell you, because it ignores the common areas. In the paid version you set the standing, the location type, the construction type, the size of the public spaces and the millwork, and the budget updates instantly, by guest rooms, common areas, OS&E, back-of-house and logistics.
What do more than 1,000 hotel budgets show?
We first set aside clearly unrealistic entries: budgets below a tenth, or above four times, our estimate. That is about one entry in five.
Standing moves the number a lot. Half a star of difference can change a budget by 40% or more.
Surface matters. The smaller the surface per key declared, compared with a standard, the lower the budget. In capital cities, surfaces per key are more often well below the standard, and budgets are lower: a median of about 20% below our estimate, against about 15% elsewhere.
The pattern is the same abroad. About six budgets in ten are below our estimate in France, and a little over half outside France.
What these figures are, and are not. They compare planned budgets with our estimate. Part of these budgets also helped calibrate our tool, so the figures show how users' budgets differ from our estimate. They do not show that either one is right, and they are not a measure of accuracy. We invent nothing: these figures are what we collected, cleaned and given back to you.
What should investors, architects and consultants do with this?
Investors. Compare your FF&E and OS&E number with an independent one before you freeze the financing. A small gap is a value engineering exercise. A large one means the programme or the positioning has to be reconsidered while it is still cheap to do so.
Architects and designers. Write down what your budget covers and what it leaves out. Most of the gaps we see come from the limits of the scope, not from the figure itself.
Consultants and project owners' representatives. Ask who owns OS&E, back-of-house and logistics. When nobody does, they are the first items to be missing.
Whoever you are, the next step is the same. Run the free estimate, note your gap, then test in the paid version what moves it: standing, public spaces, construction type, scope. A gap you can explain is a gap you can decide on.
Where does the data come from, and how is it checked?
Our reference figures rest on three sources. First, the FF&E/OS&E projects both founders have followed throughout their careers. Second, detailed budgets sent by partners (architects, investors and consultants, including from other countries) and the studies carried out on our own projects. Third, the free Figurz app, launched in 2024.
In exchange for their result, users tell us the budget they had in mind. The data is anonymised and aggregated, and is not uploaded to an AI model for analysis. No supplier pays to be part of the database. The budgets also help calibrate our tool, so the comparison above describes how planned budgets differ from our estimate; it is not a test of accuracy.
As a first check, we ran the calculator live with professionals finishing a project, with everything already bought (France, Italy, Estonia). They gave us their budget before they saw our result, and the gap was generally under 3%. These are the first cases: too few to be proof. Our commitment is simple. We do not claim to tell the truth about your project. We make sure that what we tell you is not false: we invent nothing, and we give you back what we collected, after cleaning it. The result is the best estimate with the data we hold today, as indicative ranges, not quotes. The full method is in How we build our benchmarks.
Try it: the free tool, and what the paid version adds
The free estimate takes a few seconds. For France, it gives the total FF&E and OS&E budget and the total duration, next to your own hypothesis, with an indicative construction cost to put the budget in perspective. For other countries, it splits the budget into FF&E for guest rooms, FF&E for common areas, and a figure for OS&E, back-of-house and logistics, with the installation duration. Before it shows our number, it asks for the budget you had in mind. At the end, it gives you a strategic reading of the gap.
The paid version goes further: you set the parameters yourself (standing, location type, construction type, rooms and suites, size of the public spaces, millwork) and the breakdown updates instantly: guest rooms, common areas, OS&E, back-of-house and logistics, with the schedule and the detailed limits of scope. It is built for the moment when you need to know why your budget differs, and what it would take to close the gap.
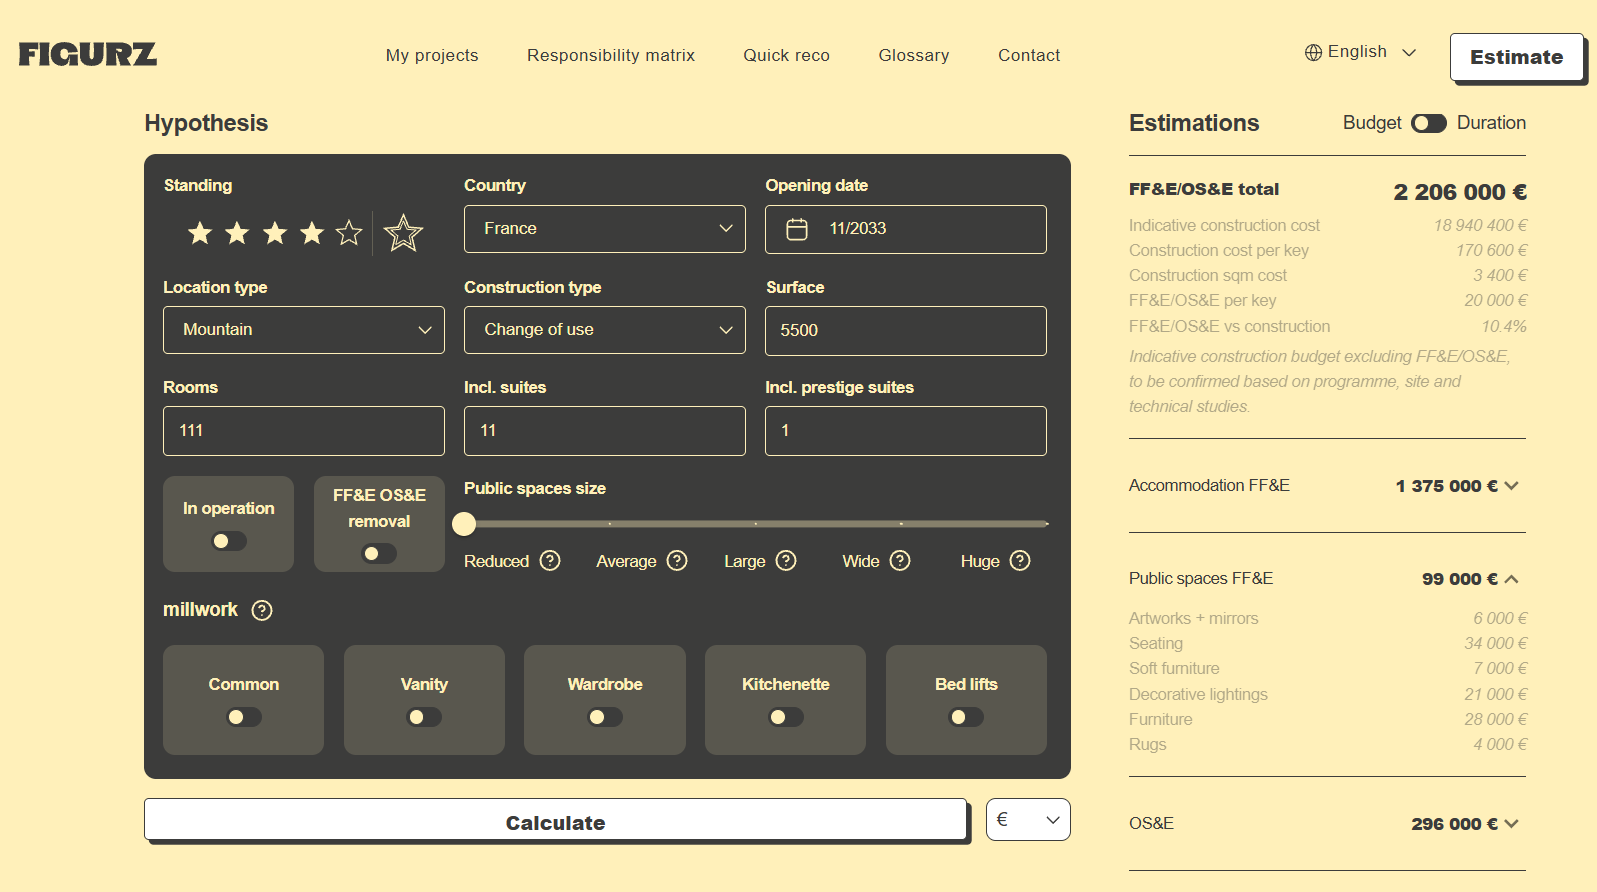
What the paid version adds: you set the parameters, the breakdown updates instantly. Fictional project. The ratio shown is FF&E/OS&E as a share of total investment (construction plus FF&E/OS&E).
FAQ
Are these final accounts? No. They are budgets that users had in mind or had planned when they used the app, before they saw our result.
Do you claim these figures are the truth? No. We do not claim to tell the truth about a project. We make sure that what we publish is not false: we invent nothing, we only give back what we collected, after cleaning it.
What is Figurz? Figurz is an independent FF&E/OS&E consultancy for hotel projects, with its own estimation tool. The company was created in Paris in 2023. Its free app gives an indicative FF&E/OS&E budget in seconds.
Who can give an independent FF&E/OS&E budget, without selling furniture? Four kinds of players, as long as they earn no commission from suppliers. Cost consultants and quantity surveyors build an auditable line-item cost plan, provided you ask explicitly for the hotel FF&E/OS&E scope. Owner’s representatives and independent purchasing agents manage the budget and the tender on the owner’s side. Specialised FF&E/OS&E consultancies work on budgets, schedules and scope limits without selling product. Online tools give a first order of magnitude: the free Figurz estimate is independent, while some tools are published by furniture suppliers and lead to a quote request. Whoever you choose, ask in writing whether they earn any commission, rebate or procurement fee from suppliers.
Are hotel FF&E budgets usually too low? Often lower than a full estimate, but not always. In Figurz data, about six planned budgets in ten are below the estimate, and about a quarter are more than 30% above it.
How much does half a star change an FF&E budget? By 40% or more. A project that aims at five stars with a budget closer to 4.5 stars can sit about 40% below a full estimate.
What is a typical hotel FF&E and OS&E budget per key? Per key means the total FF&E and OS&E budget of the hotel, including common areas, back-of-house and logistics, divided by the number of rooms. As indicative ranges: Budget (2 to 3 stars) €8,000 to 17,000; Midscale (3 to 4 stars) €13,000 to 38,000; Upscale (4 to 5 stars) €20,000 to 75,000; Luxury (5 stars and above) €55,000 to 150,000 and more. These are ranges, not quotes. See the per-key benchmark page.
Is the data sent to an AI model? No. It is anonymised and aggregated, and it is not uploaded to an AI model for analysis.
Can a supplier pay to appear in the database? No. No supplier pays to be part of it.
How accurate is the estimate? In our first live checks with projects at the end of their purchasing, in France, Italy and Estonia, the gap was generally under 3%. These are the first cases: too few to be proof. The figures are indicative ranges, not quotes.
Does it work for countries other than France? Yes. We adjust for each country using public labour cost data and whether the furniture is made locally or imported. Our figures are most precise for France.
